Analytics
The whole market
on one page.
Signals tell you that something happened. The Analytics page in the mini app shows the context around it: where the stops are, what the whales are doing, how the options market prices the coming weeks.
01
Setup and levels
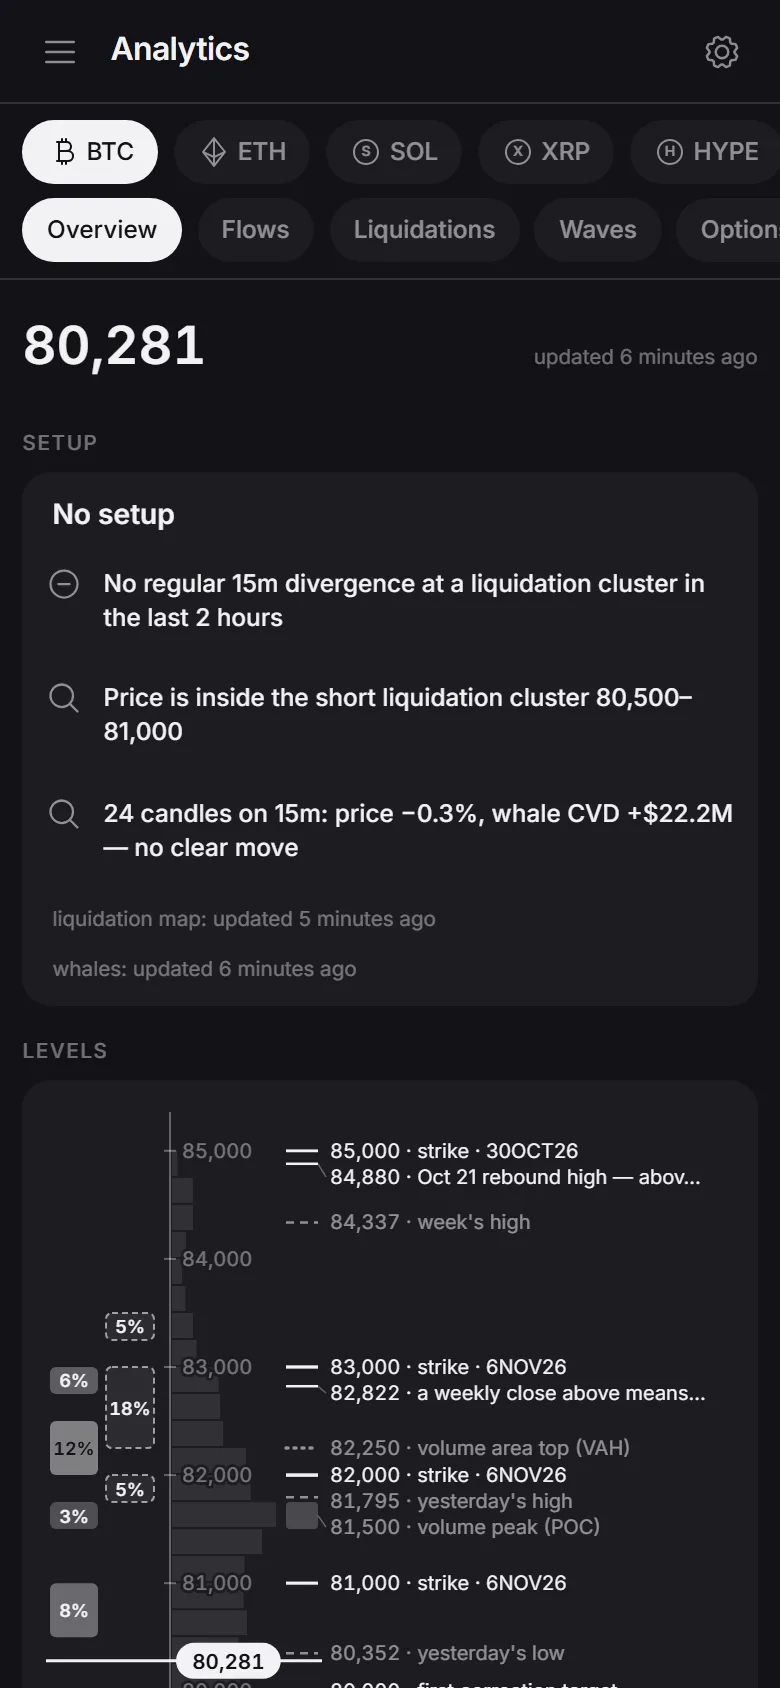
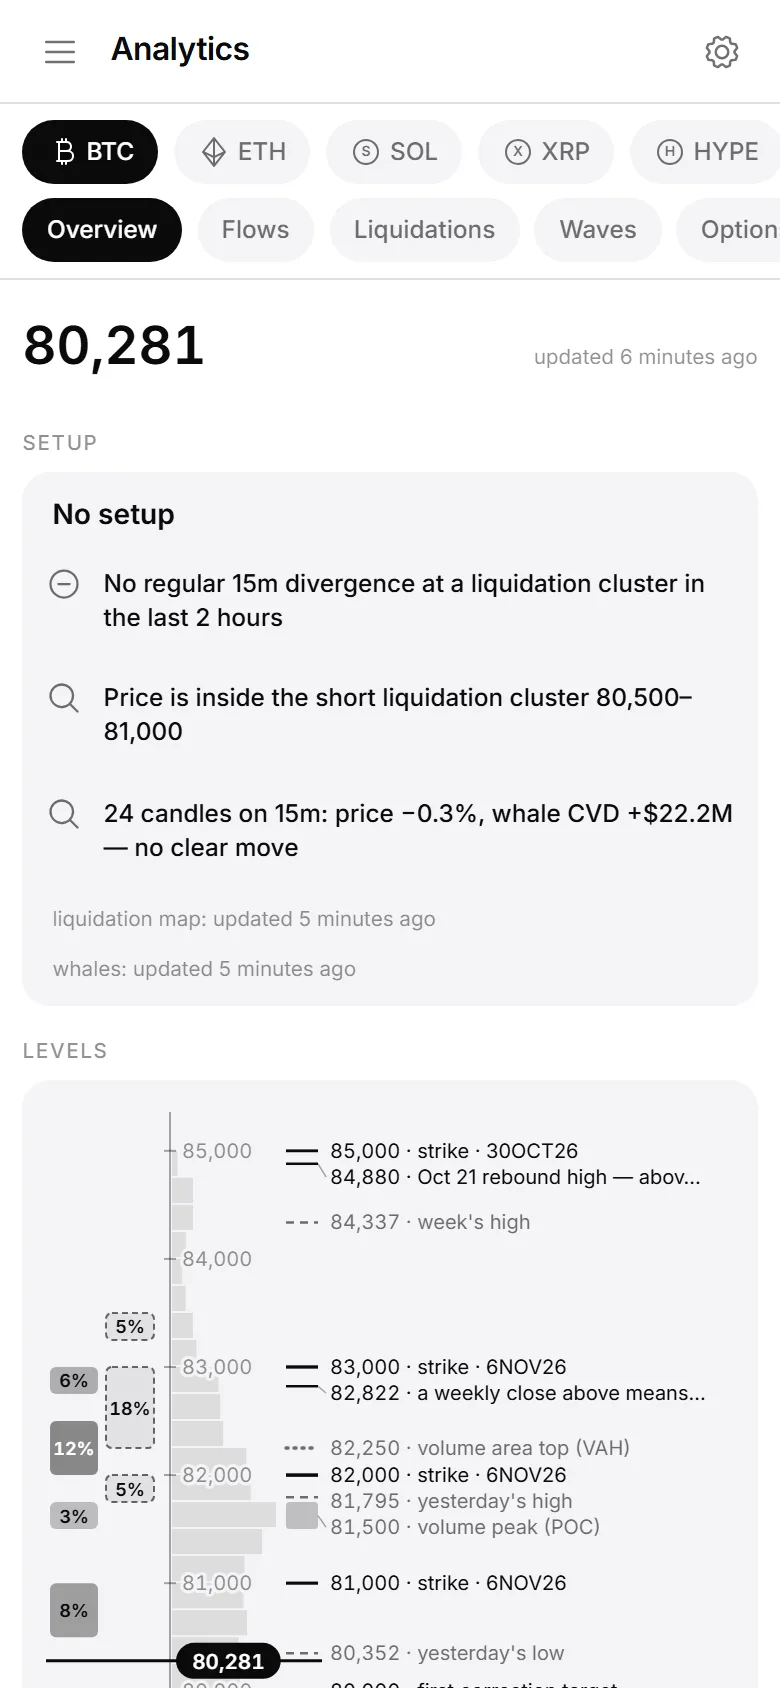
A rule checked condition by condition: a 15-minute divergence whose second point sits inside a liquidation cluster, confirmed by the whales. The page shows the stage and each condition with a mark — not a call to buy or sell.
- BTC, ETH, SOL, XRP, HYPE, DOGE, gold (XAU), refreshed every few minutes
- Price levels: liquidation clusters, option strikes, wave count
- Wave-count scenarios are long-term and updated by analysts
02
Liquidation map
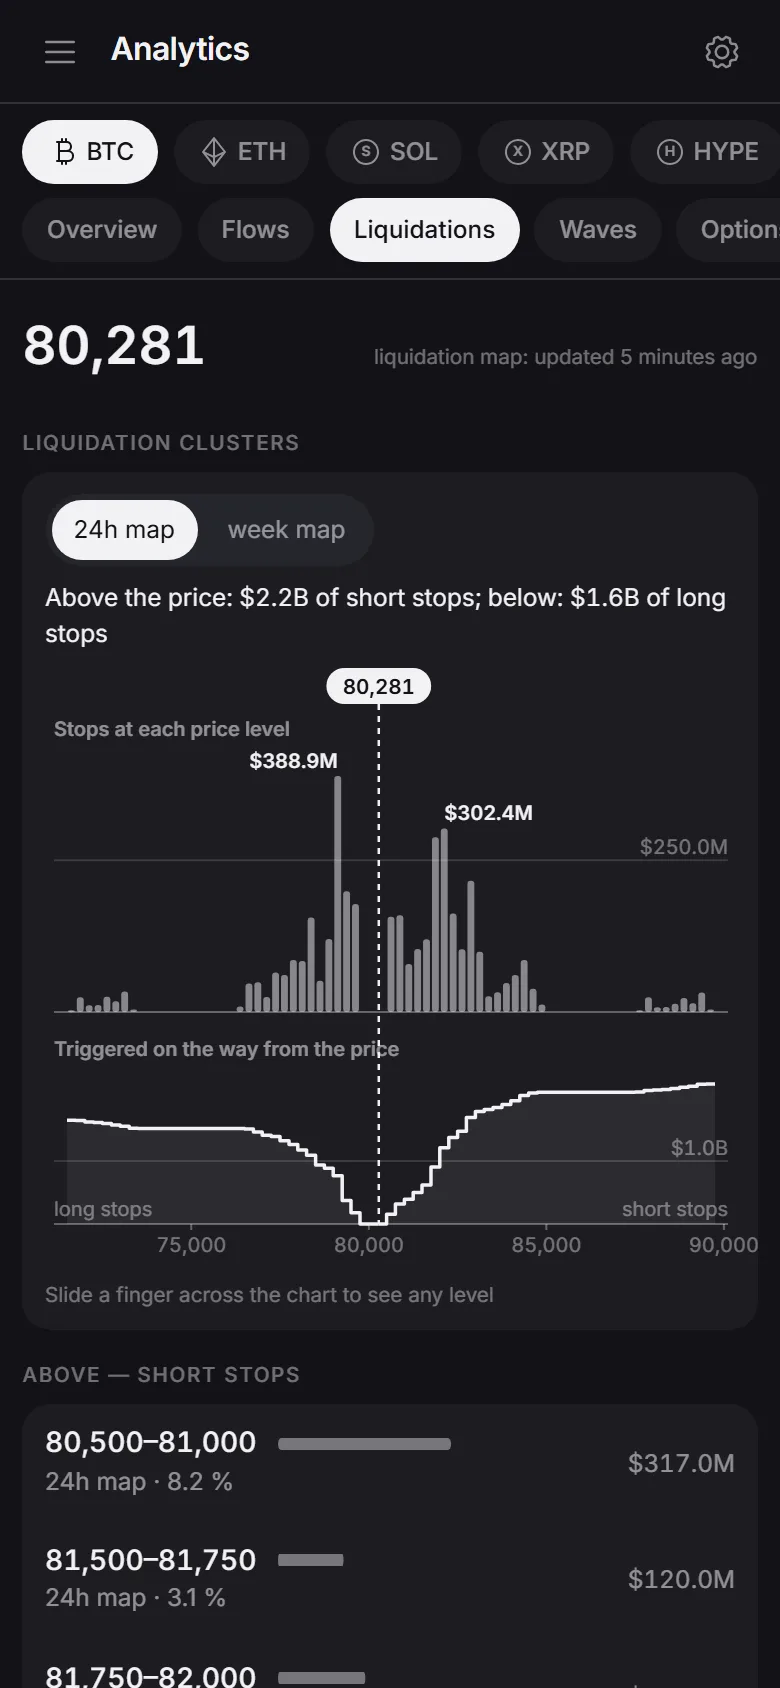
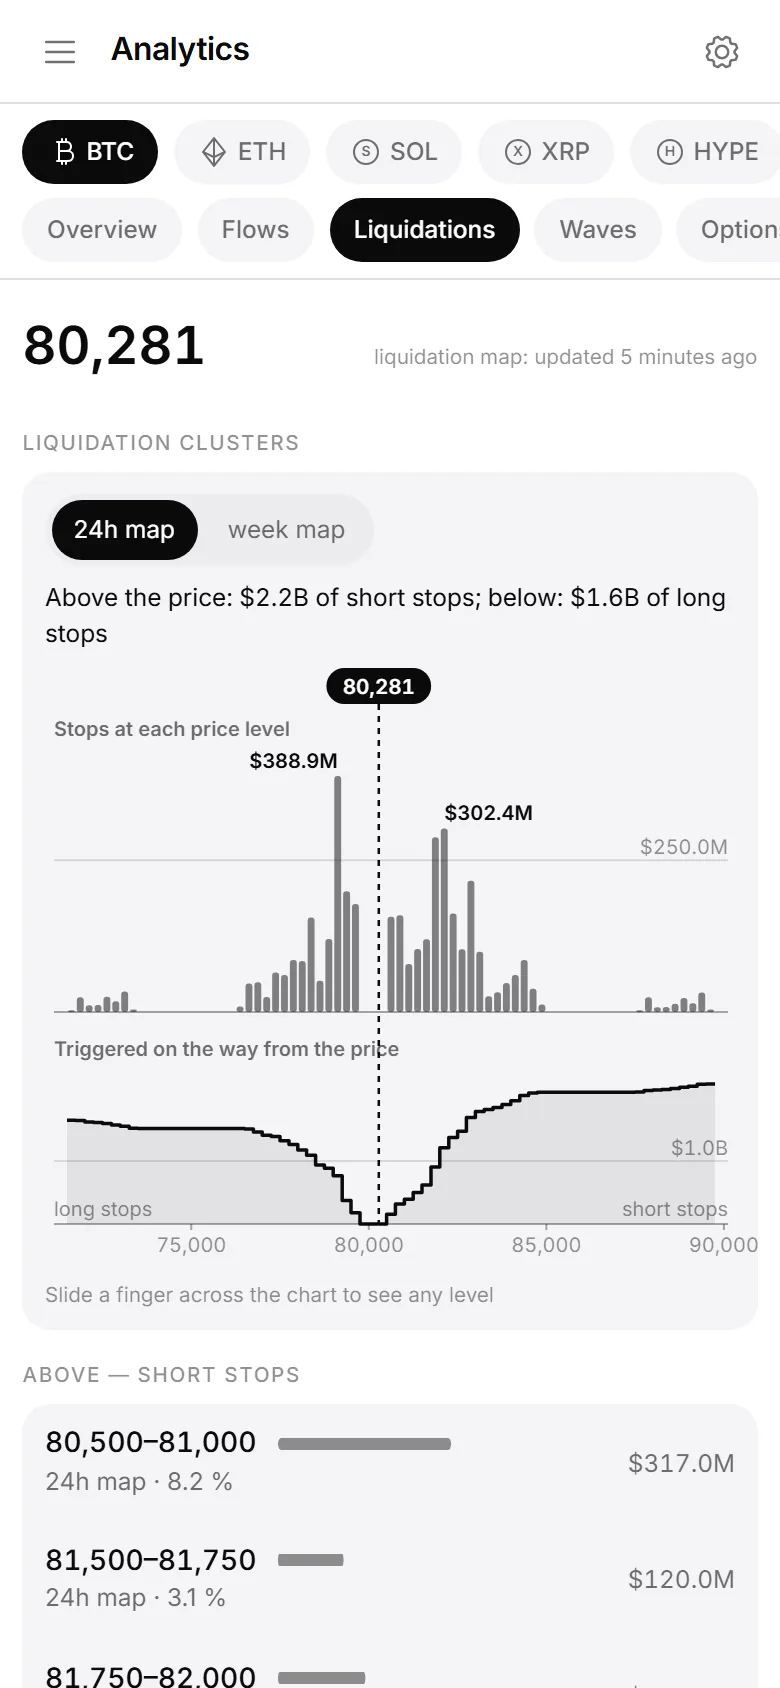
Where the stops of leveraged traders are piled up above and below the price, on the 24-hour and weekly maps — with the size of each cluster and its share of the map.
- Short stops above the price, long stops below
- Size in dollars and share of the map in %
- Facts only: where the stops are and how large, with no judgement
03
Options radar
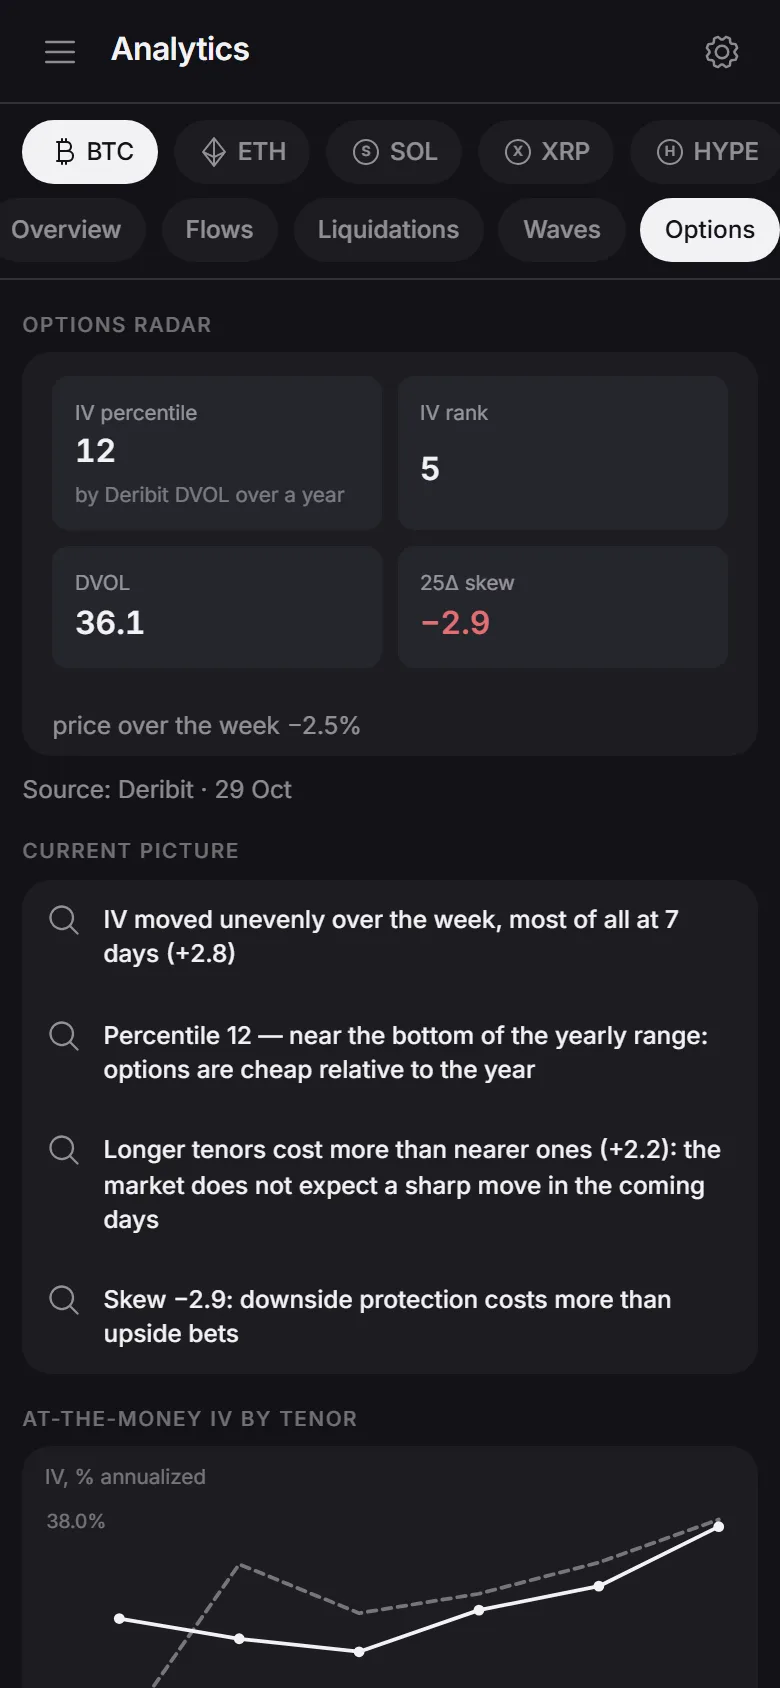
Implied volatility by tenor now and a week ago, its percentile over the year, 25-delta skew and the smile — for all seven instruments, with the current picture in plain words.
- Data from the largest venues: Deribit for BTC and ETH, Bybit for the rest
- Expensive or cheap volatility is judged by the percentile over the year: a single spike does not throw it off
- Where options barely trade, it is marked: those numbers are less reliable
Also on the page
-
Whales and retail
Large and small orders on 15m, 1h, 4h and 1d: who is buying, who is selling, and what the price did meanwhile.
-
ETF flows
Daily inflows and outflows of the spot ETFs on BTC, ETH, SOL, XRP, HYPE and DOGE and of the GLD gold fund, with the series and the usual day for comparison.
-
Calendar
Macro releases and option expiries ahead, so that a move on a Fed day does not come as a surprise.
Who sees Analytics
The Analytics page comes with the subscription, at the same price as the alerts. The first 24 hours are full access, free. Without a subscription, the page description and the week-old options radar are open.
Start
24 hours free.
Then $29.99 for 30 days.
No card, no exchange account, no keys. Press start and the bot begins watching the market for you within the same minute.